Example/Applications
Check Natural Frequency
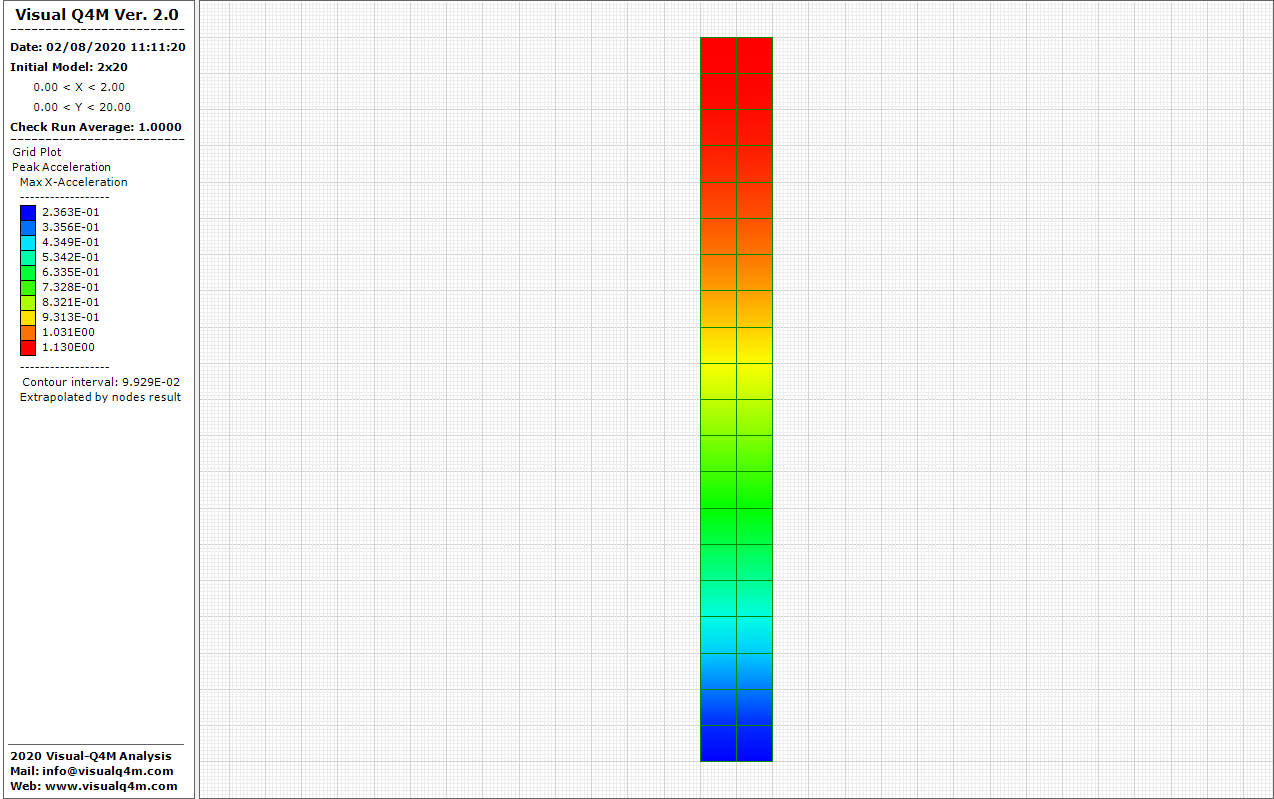
Resonance frequency

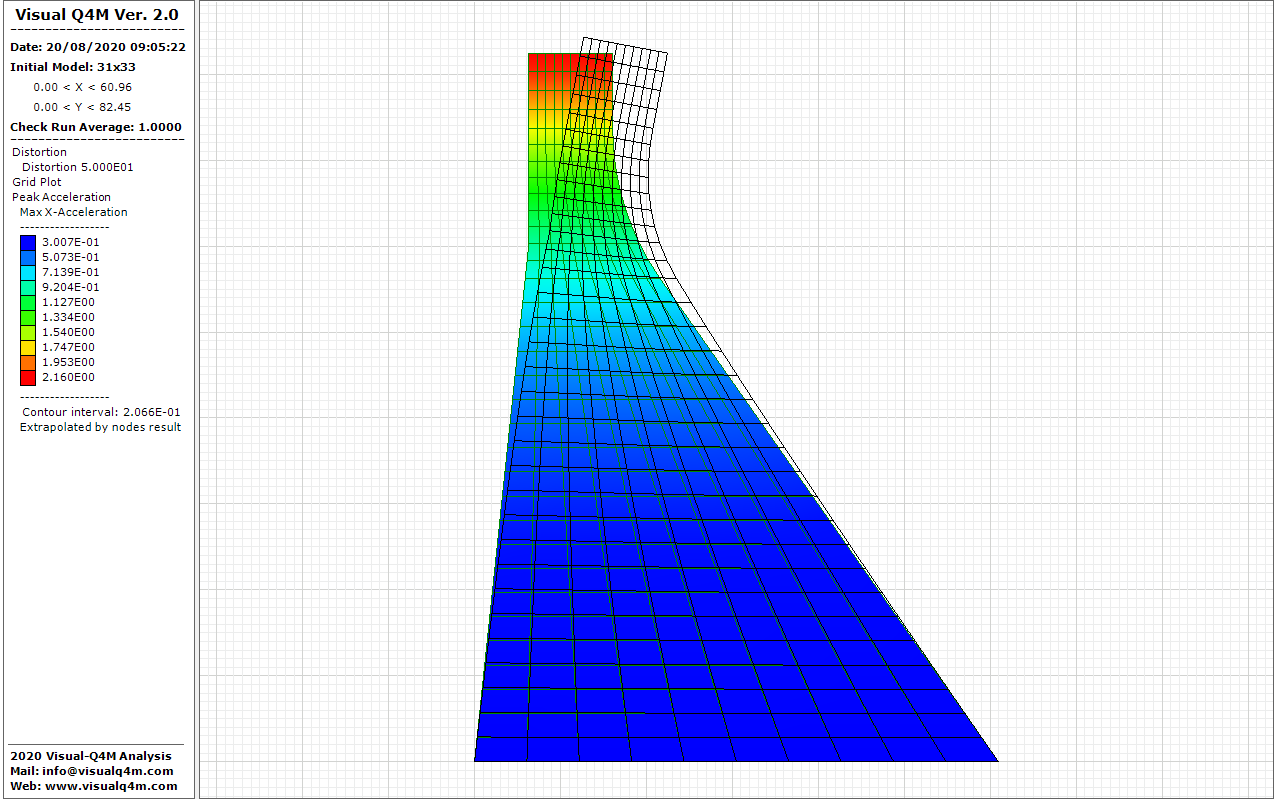
Concrete dam
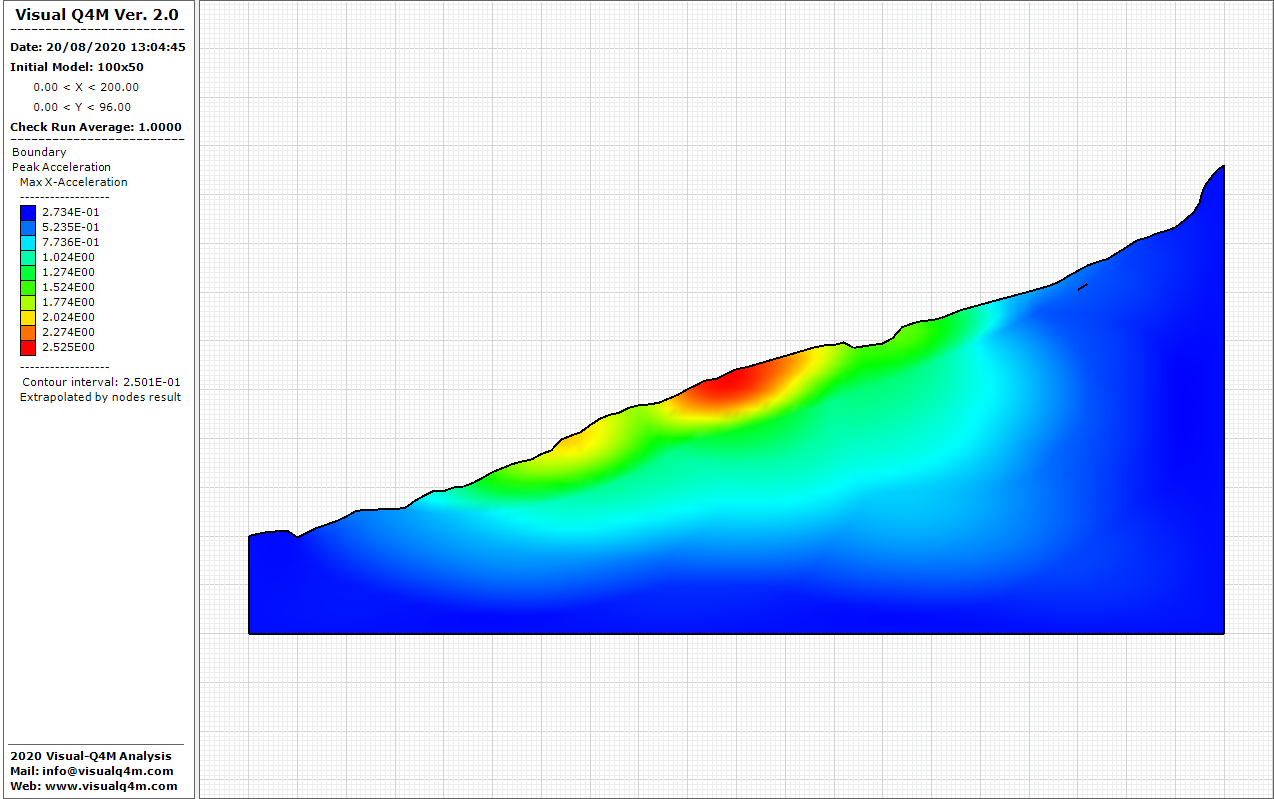
Acceleration peak on the slope
Superficial focus

MultiRun analysis
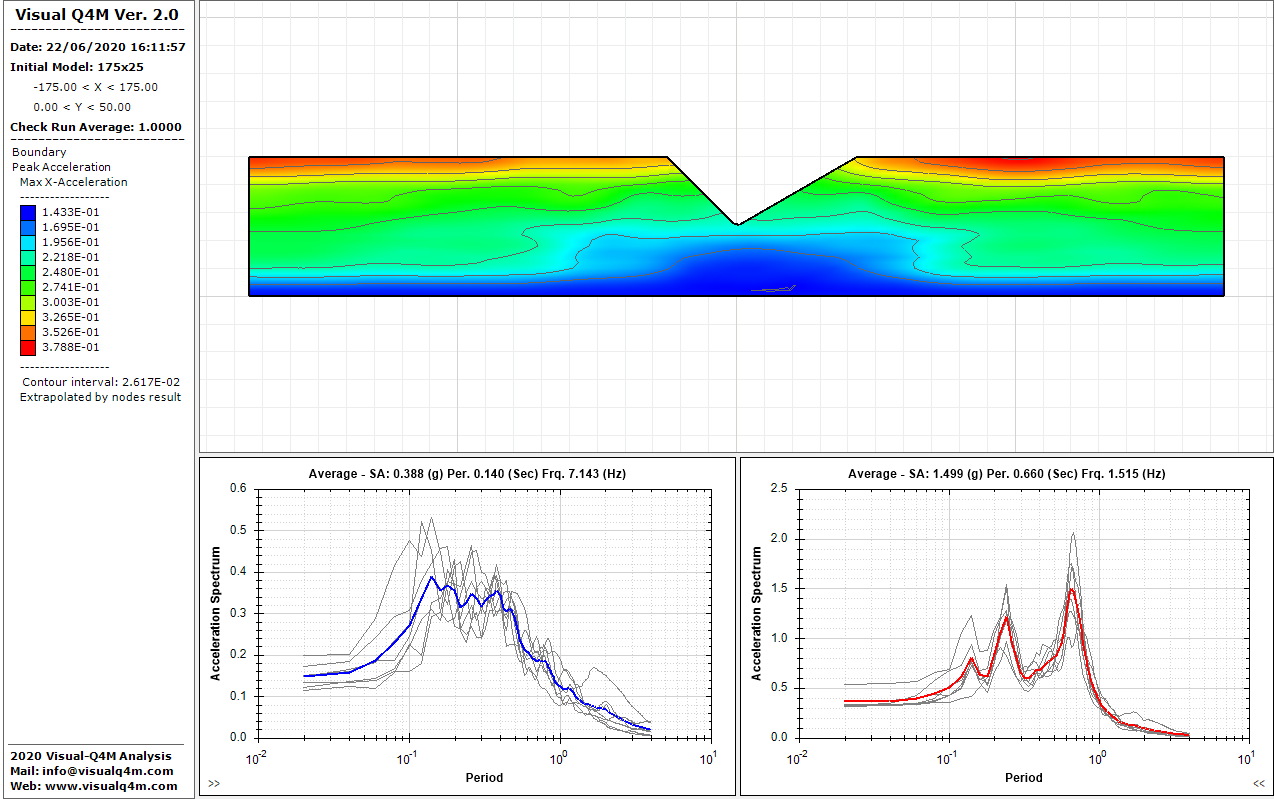
In the Visual-Q4M it is possible view the acceleration in output (horizontal or vertical component) on the nodes selected.

For Input and Output component it's possible view:
Only for output component:


It's possible to change the aspect both input or output graphic. In the chart:
For each recording it is possible to process the signal and to define the period T1 and T2 for the calculation of Housner Intensity and of Von Thun intensity.
It is calculated as the amplification factor the ratio of the intensity of the selected node and the intensity of the dynamic input:
Check Natural Frequency
Resonance frequency
Concrete dam
Acceleration peak on the slope
Superficial focus
MultiRun analysis
Copyright © 2025 - All Rights Reserved - visualq4m.com
Template by OS Templates