Example/Applications
Check Natural Frequency
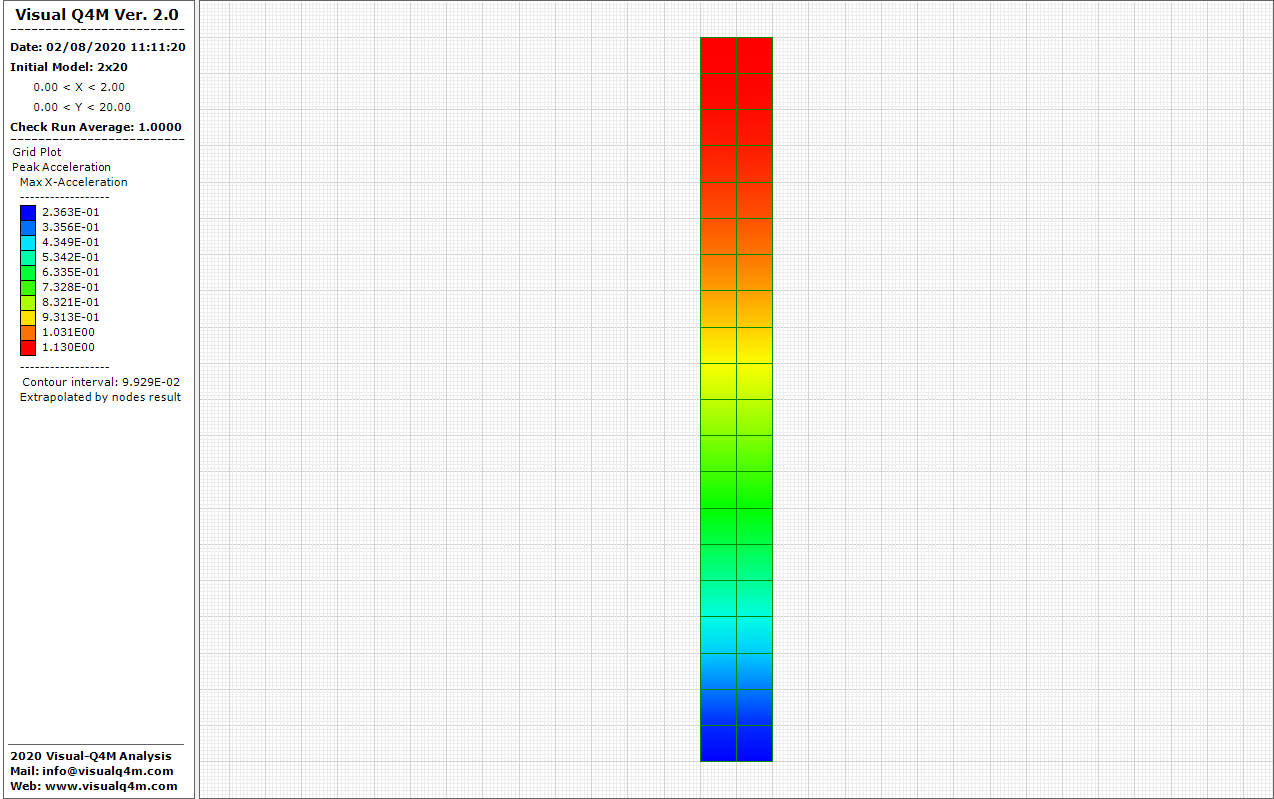
Resonance frequency

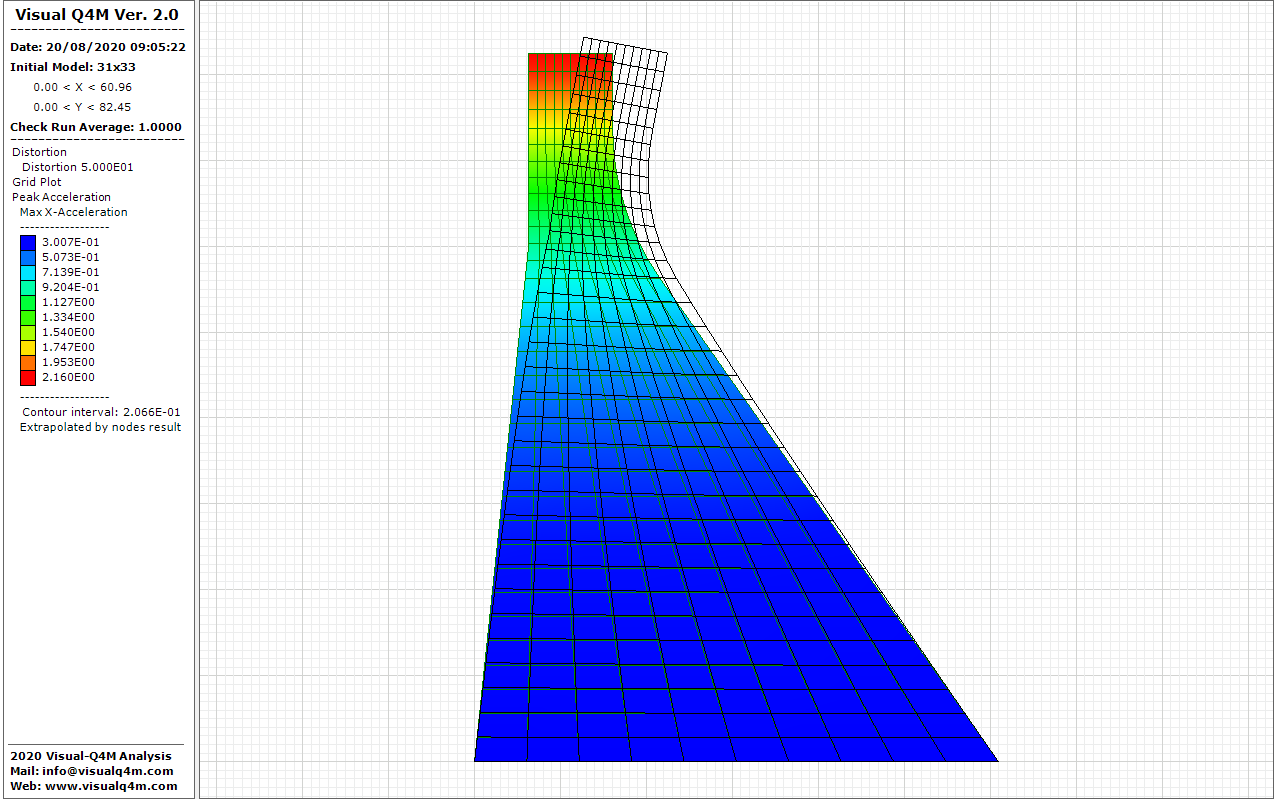
Concrete dam
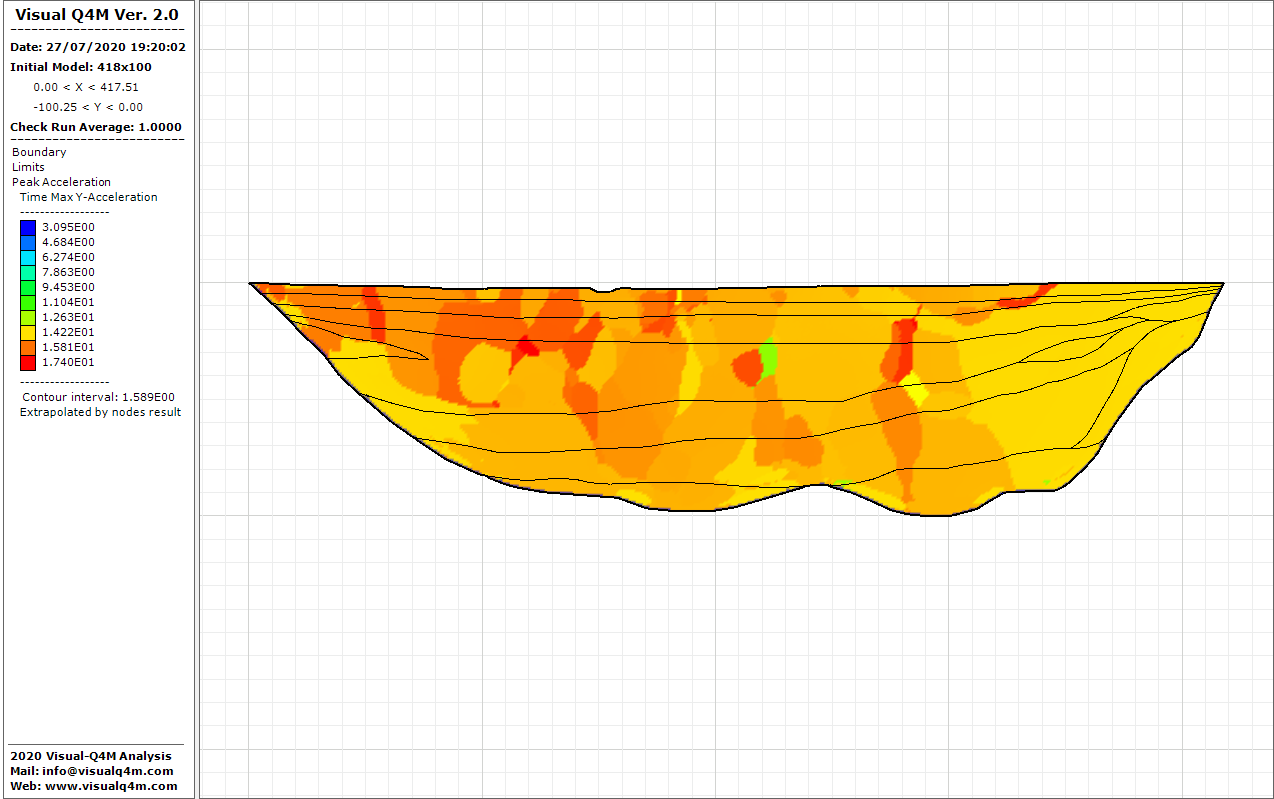
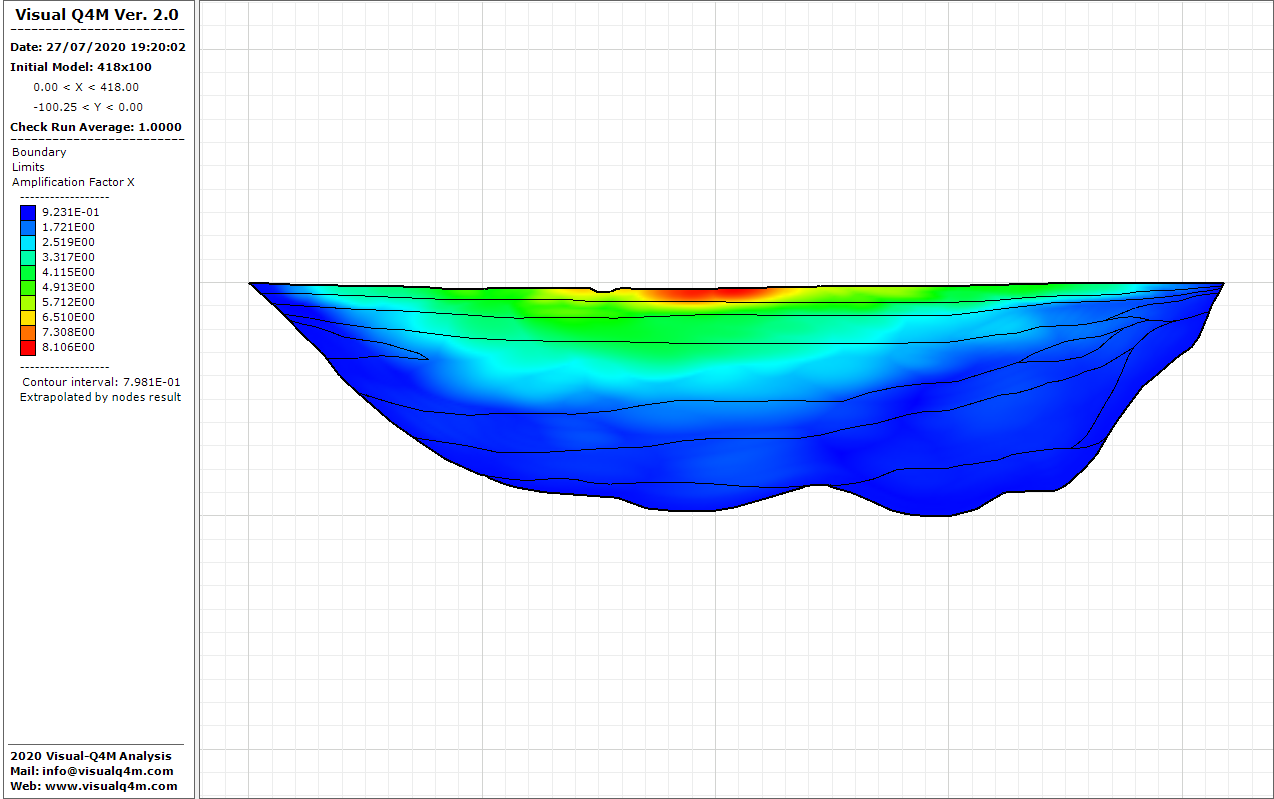
Acceleration peak on the slope
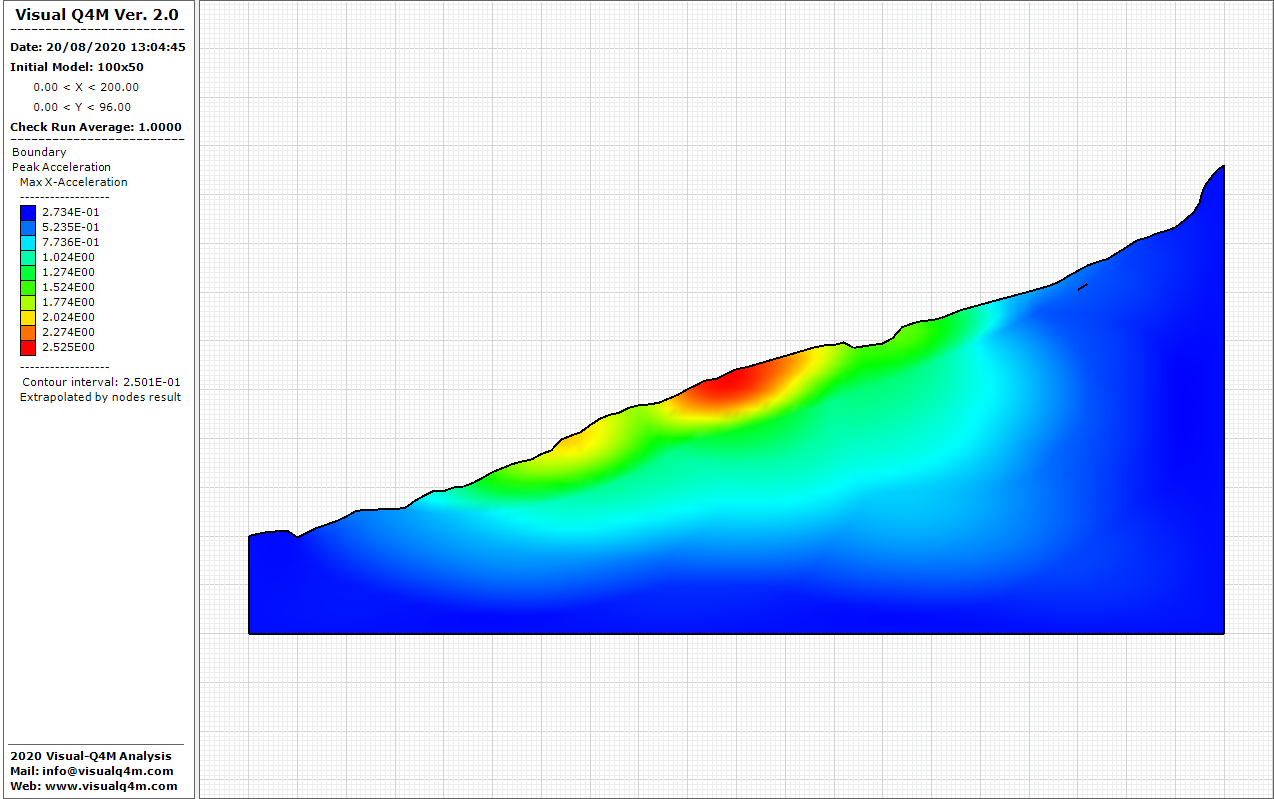
Superficial focus


In the Visual-Q4M it is possible choose the items plot to view the results of the dynamic analysis.
Item Plot: Model:
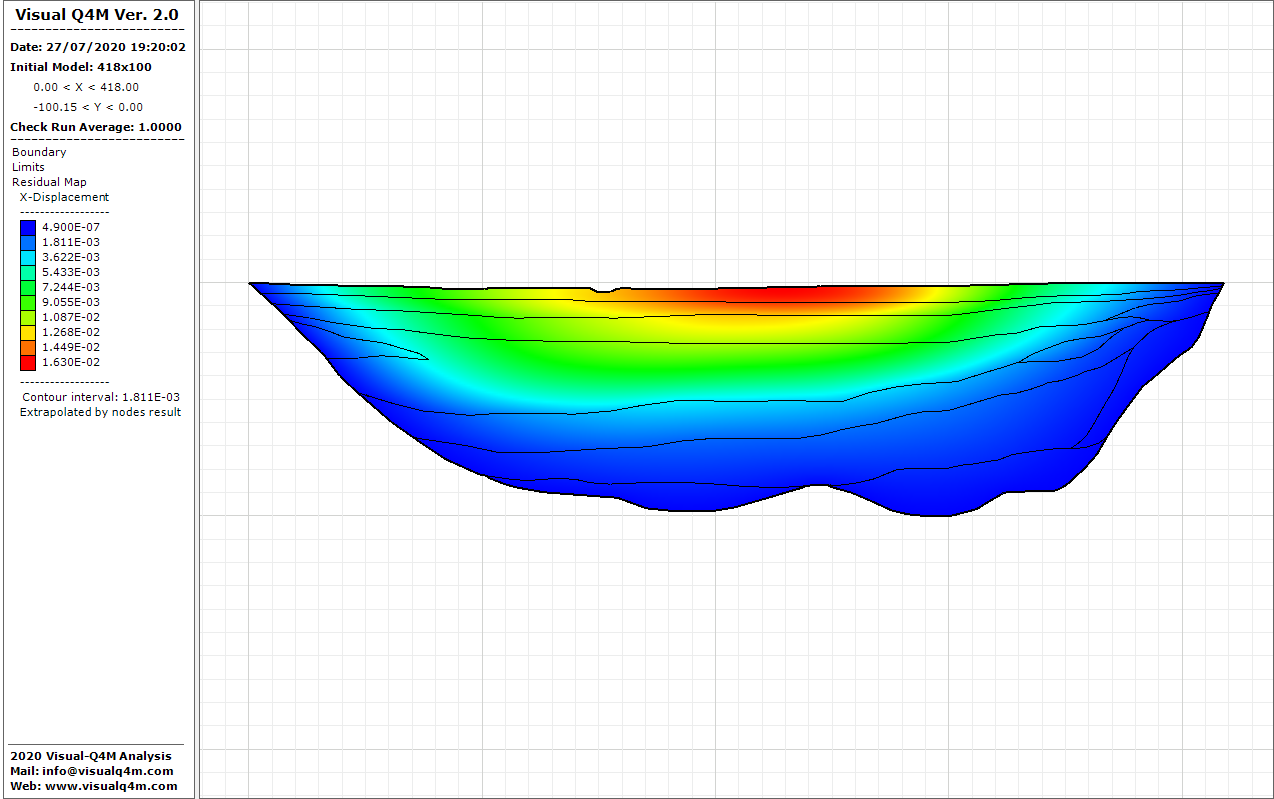
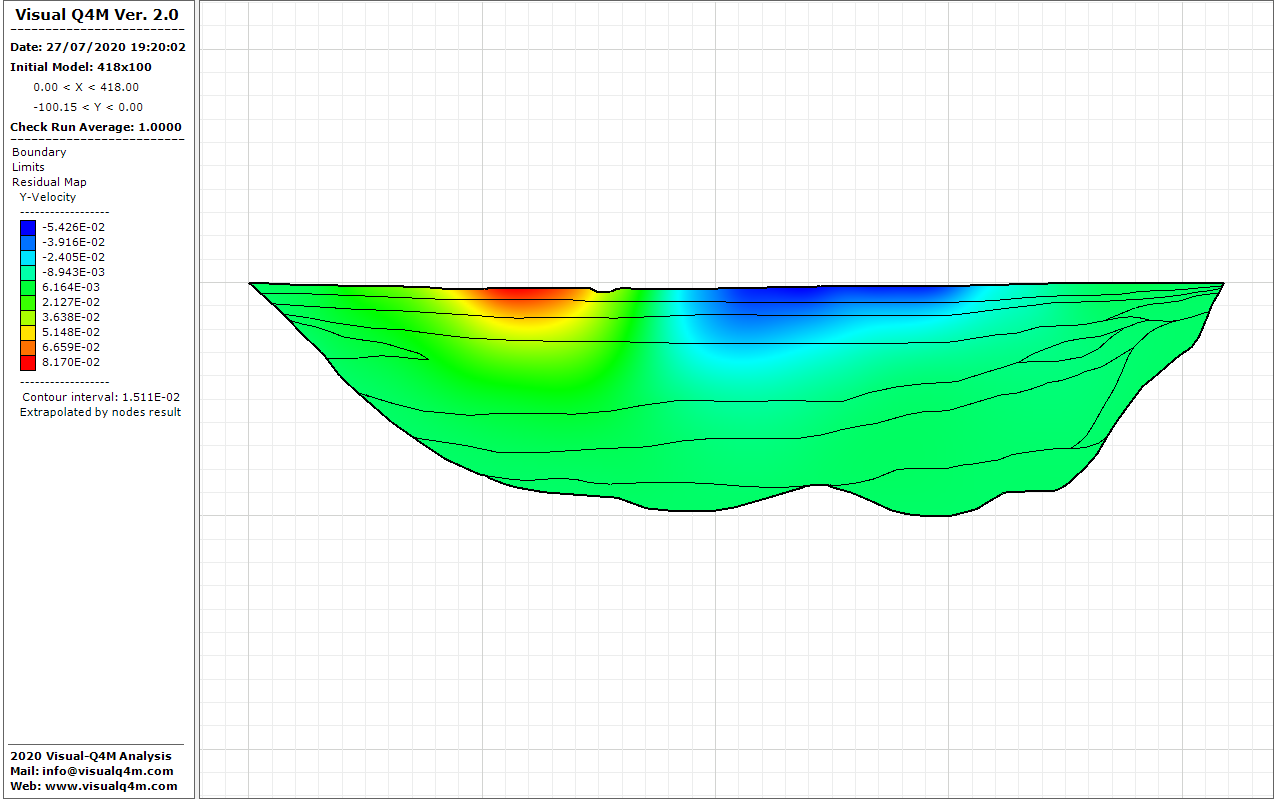
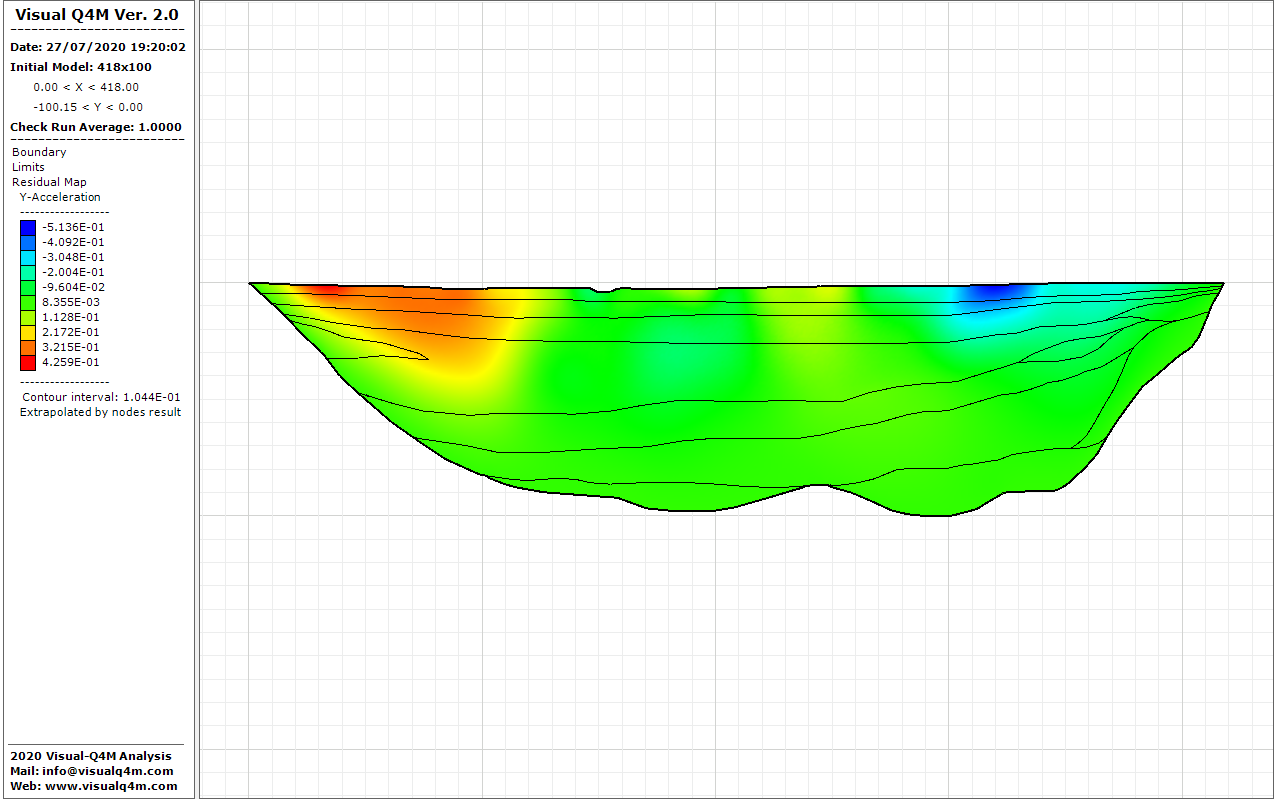
Item Plot: Residual Map:
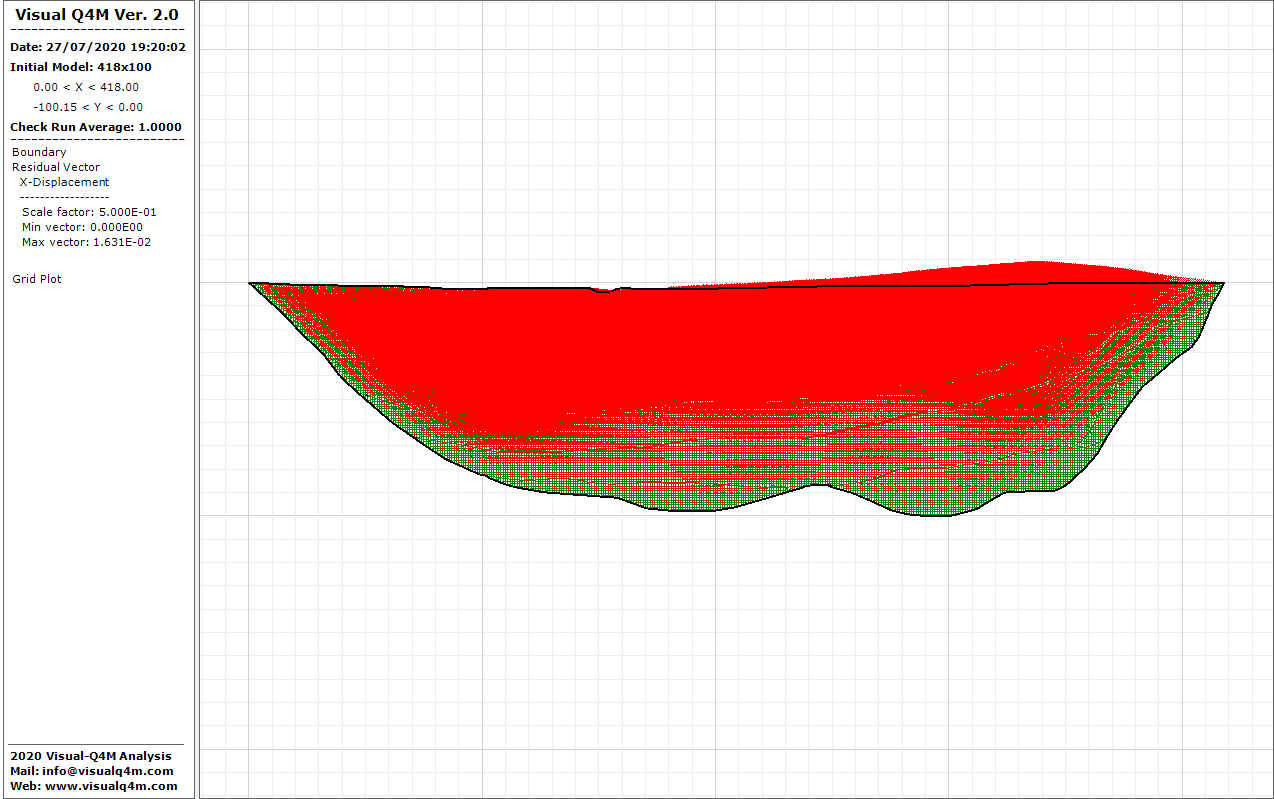
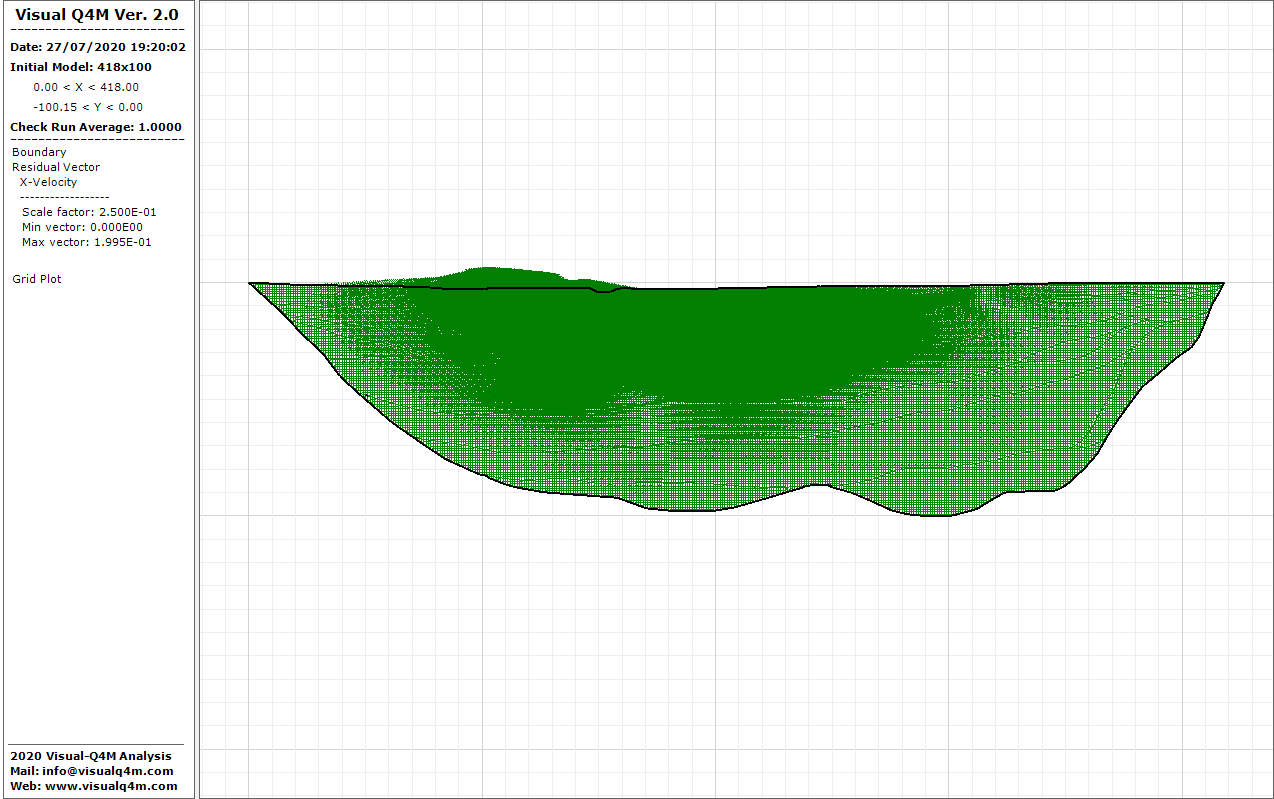
...and other Item Plot


In ColorMap view you can see the isolines contour with a defined range. In the pop-up windows it's possible choose the intervals number and the color of the visualization.


Check Natural Frequency
Resonance frequency
Concrete dam
Acceleration peak on the slope
Superficial focus
Copyright © 2025 - All Rights Reserved - visualq4m.com
Template by OS Templates