Example/Applications
Check Natural Frequency
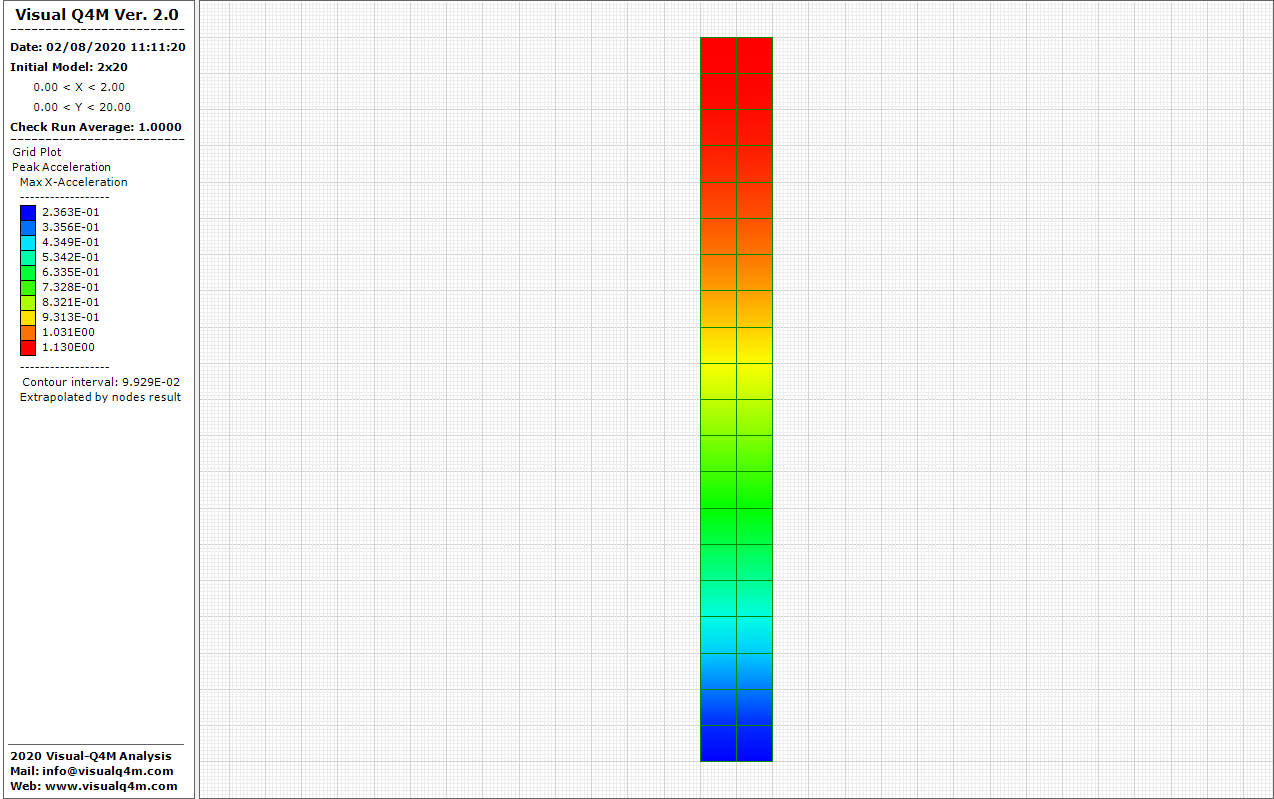
Resonance frequency

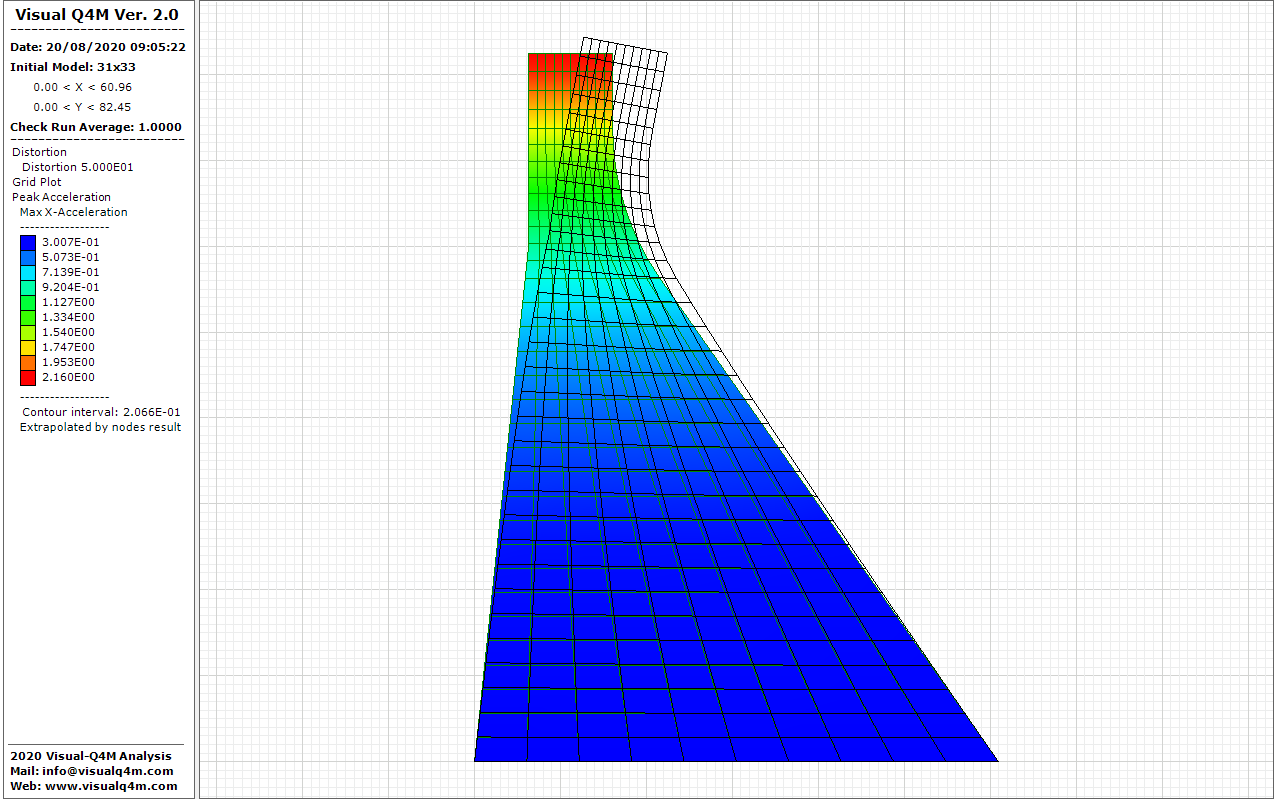
Concrete dam
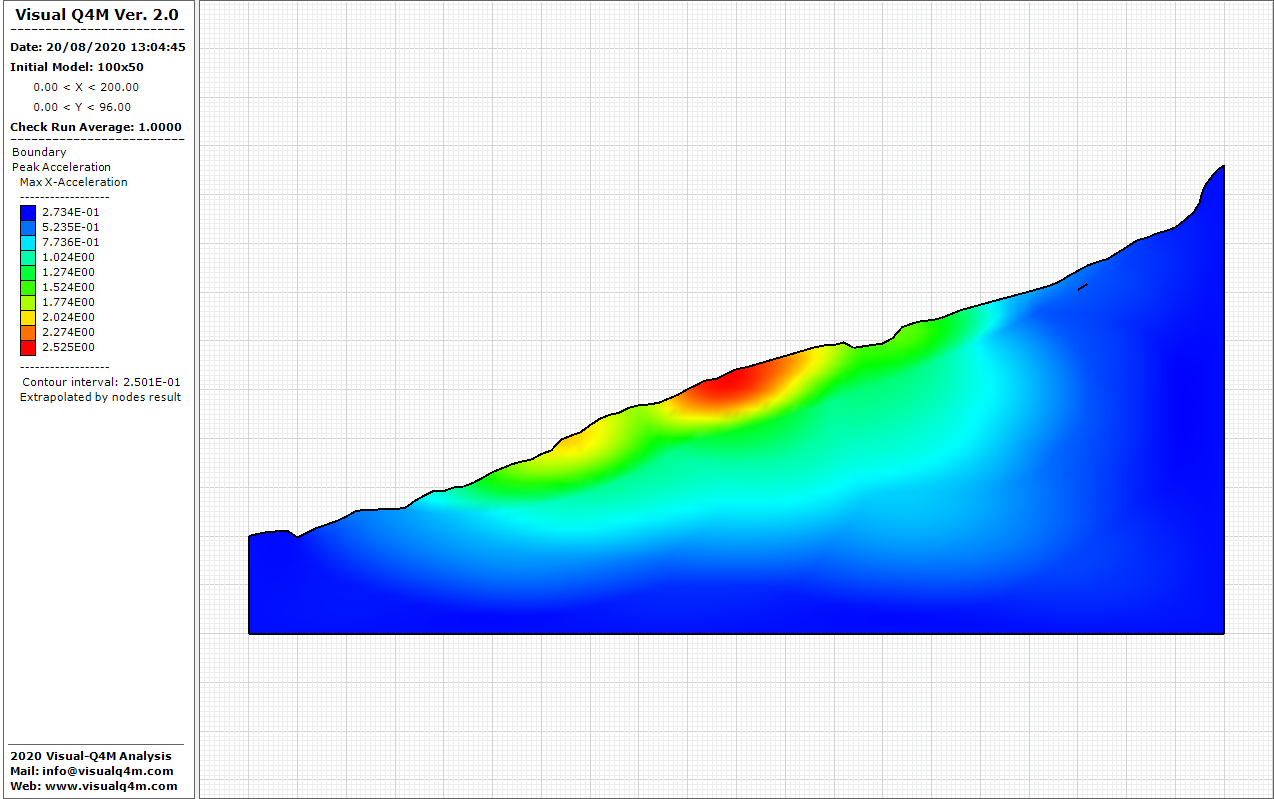
Acceleration peak on the slope
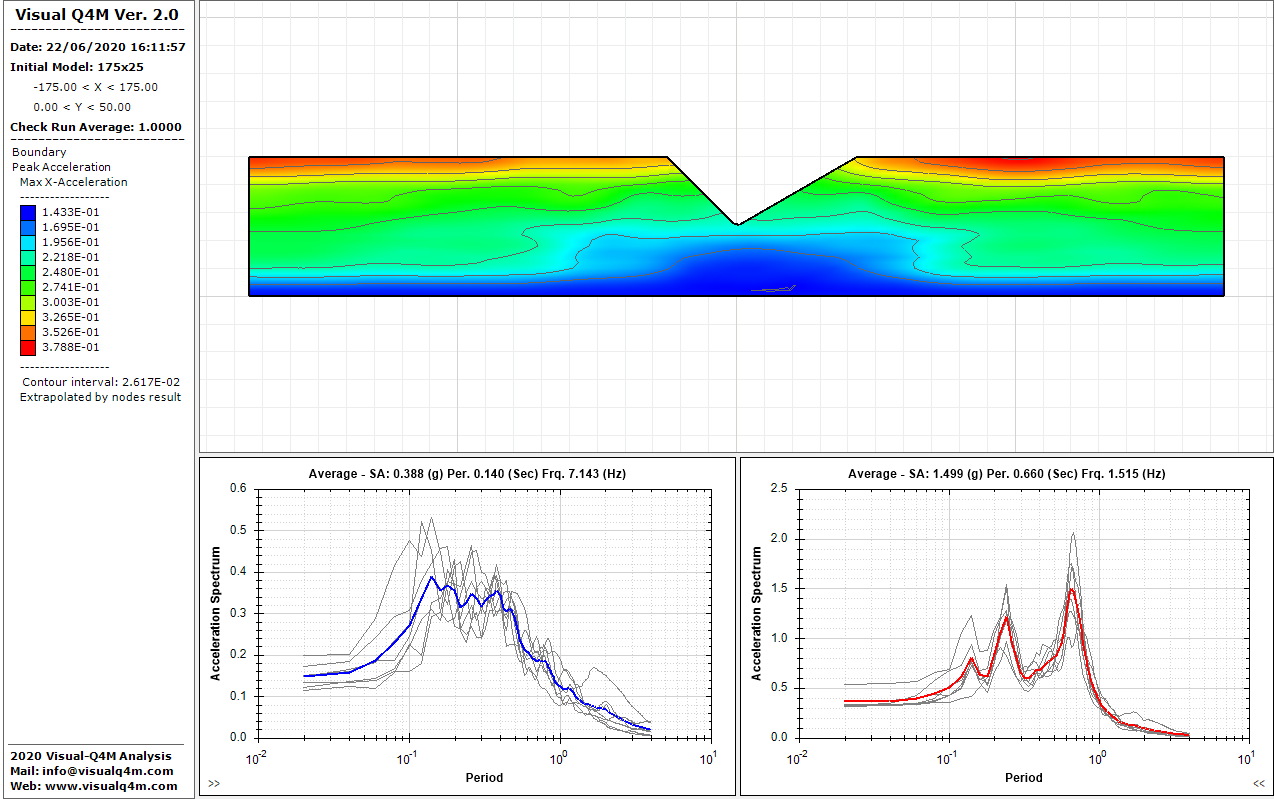
Superficial focus

MultiRun analysis
In Visual-Q4M, for each vertical of grid, it is possible to see an evolutionary trend of results in depth function. If an Equivalent linear analysis has been performed The characteristic dynamic parameters (G/G0-γ and D-γ) are updated progressively using curves of variation parametric as a function of the level of strain. It is possible to see the variation of Shear Modulus and Damping Ratio with strain.
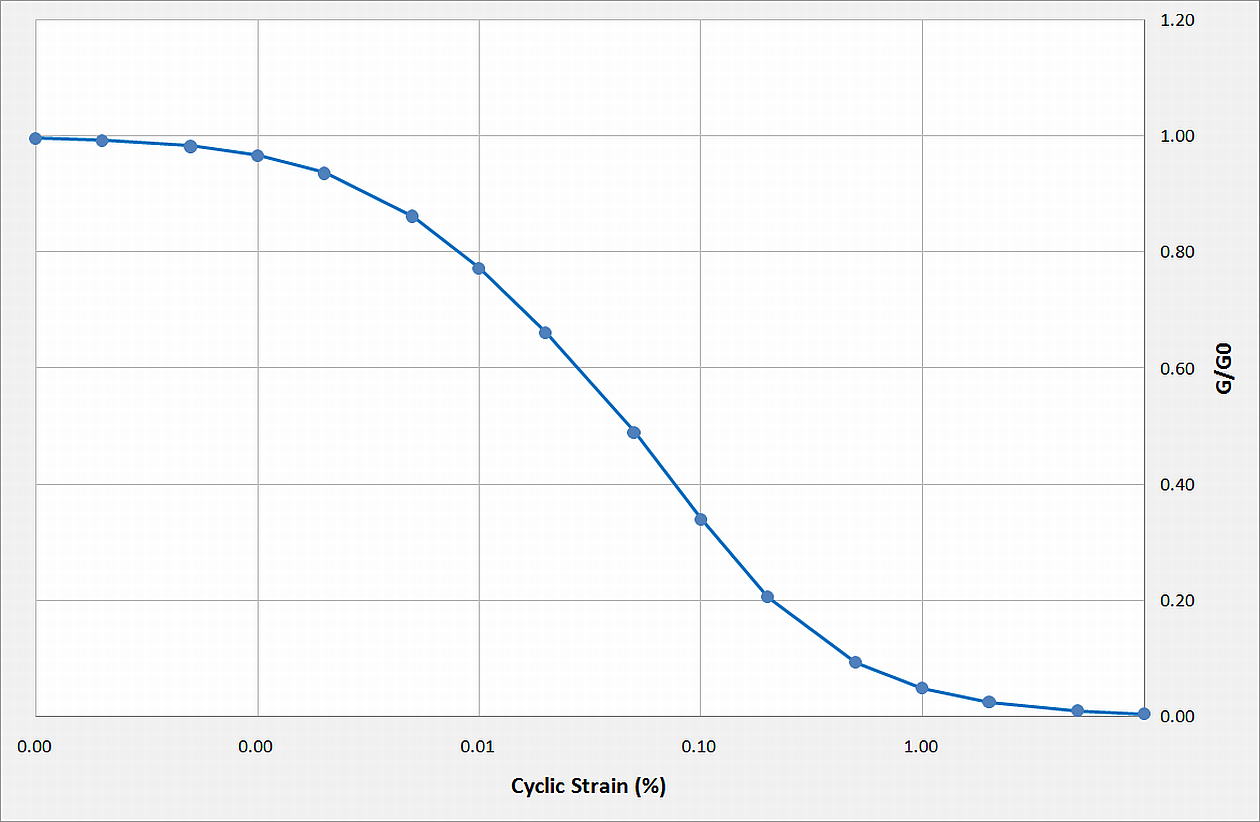

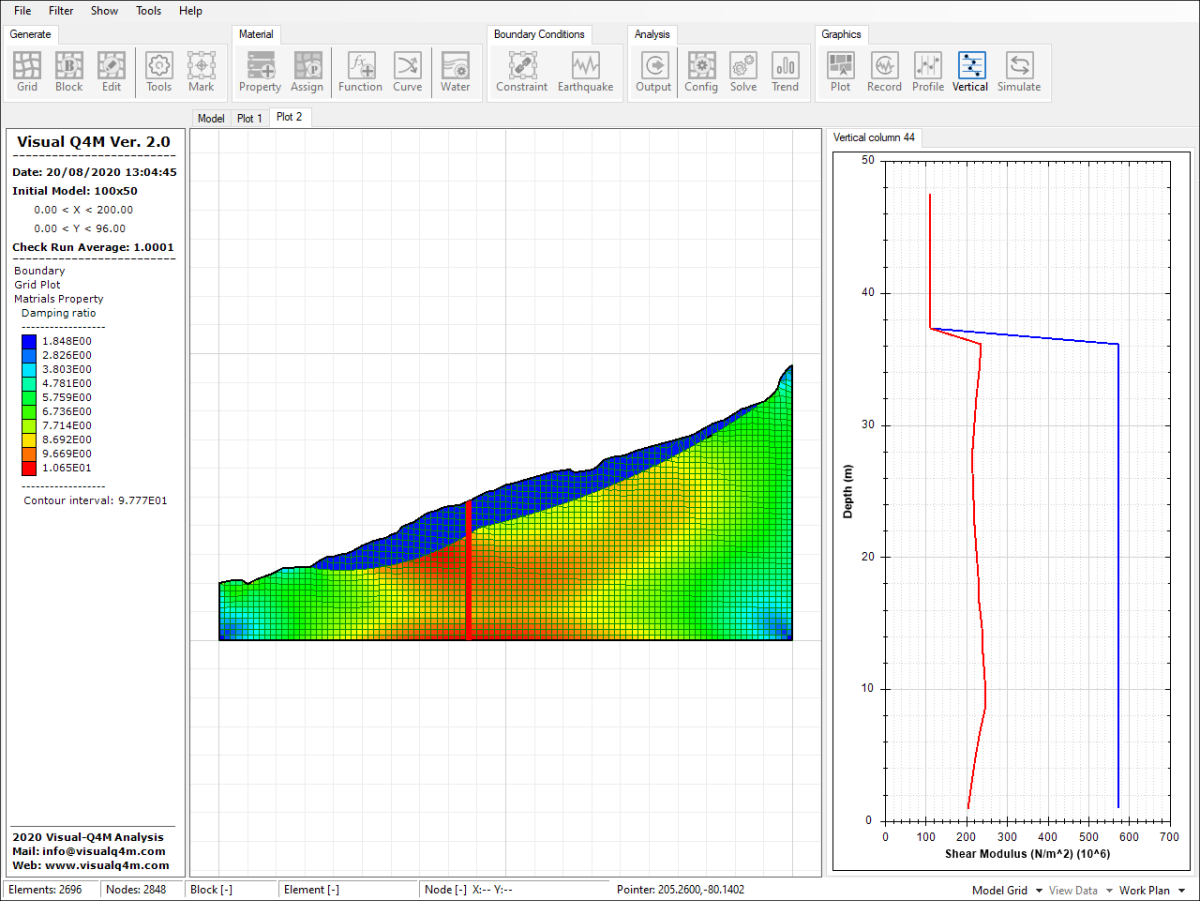
For every chart it's possible to select the property the following properties:

Check Natural Frequency
Resonance frequency
Concrete dam
Acceleration peak on the slope
Superficial focus
MultiRun analysis
Copyright © 2025 - All Rights Reserved - visualq4m.com
Template by OS Templates