Example/Applications
Check Natural Frequency
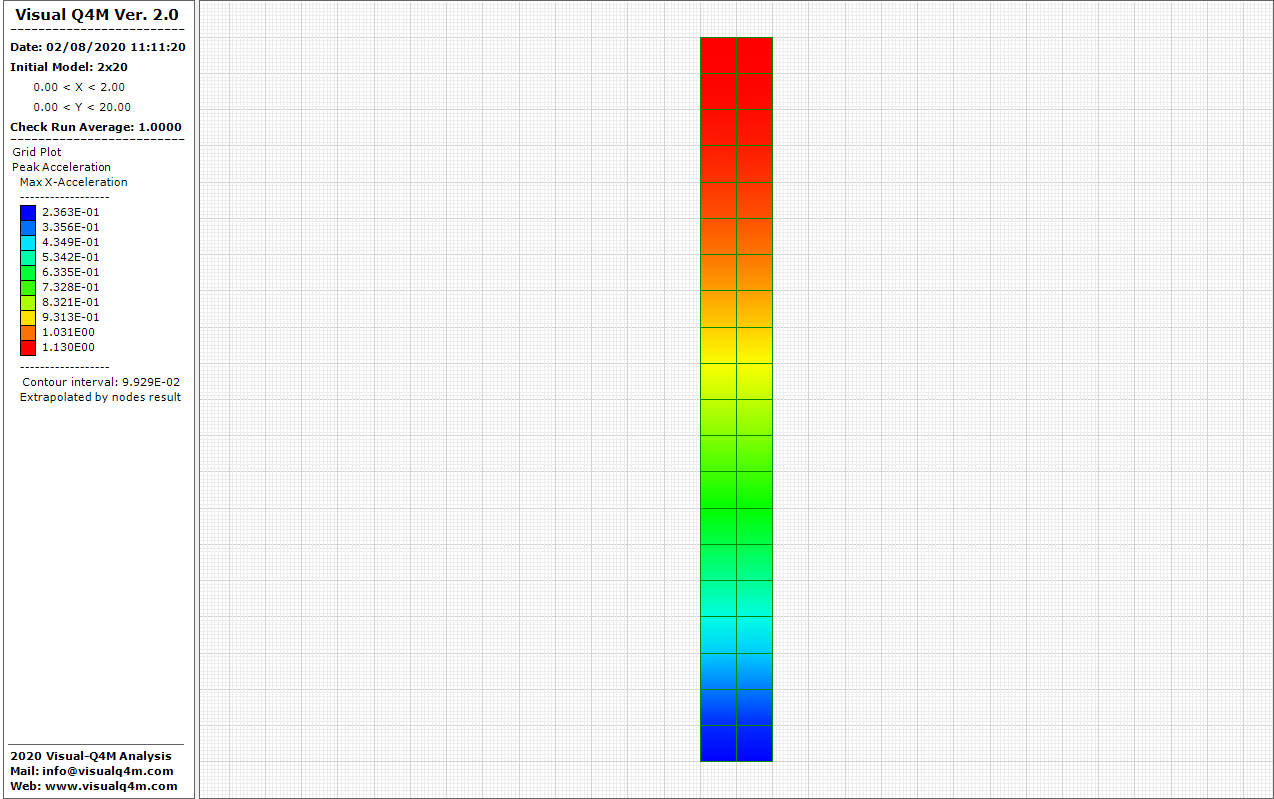
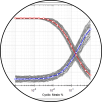
Resonance frequency

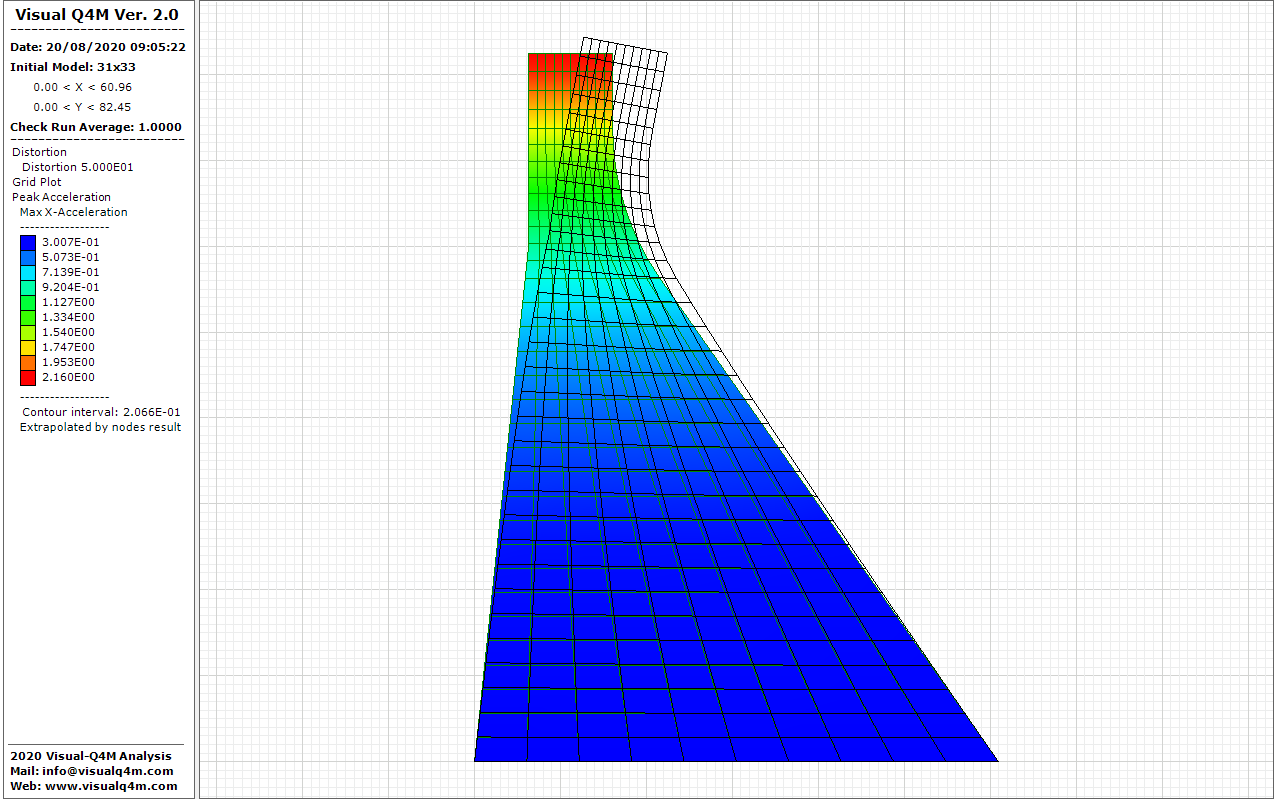
Concrete dam
Acceleration peak on the slope
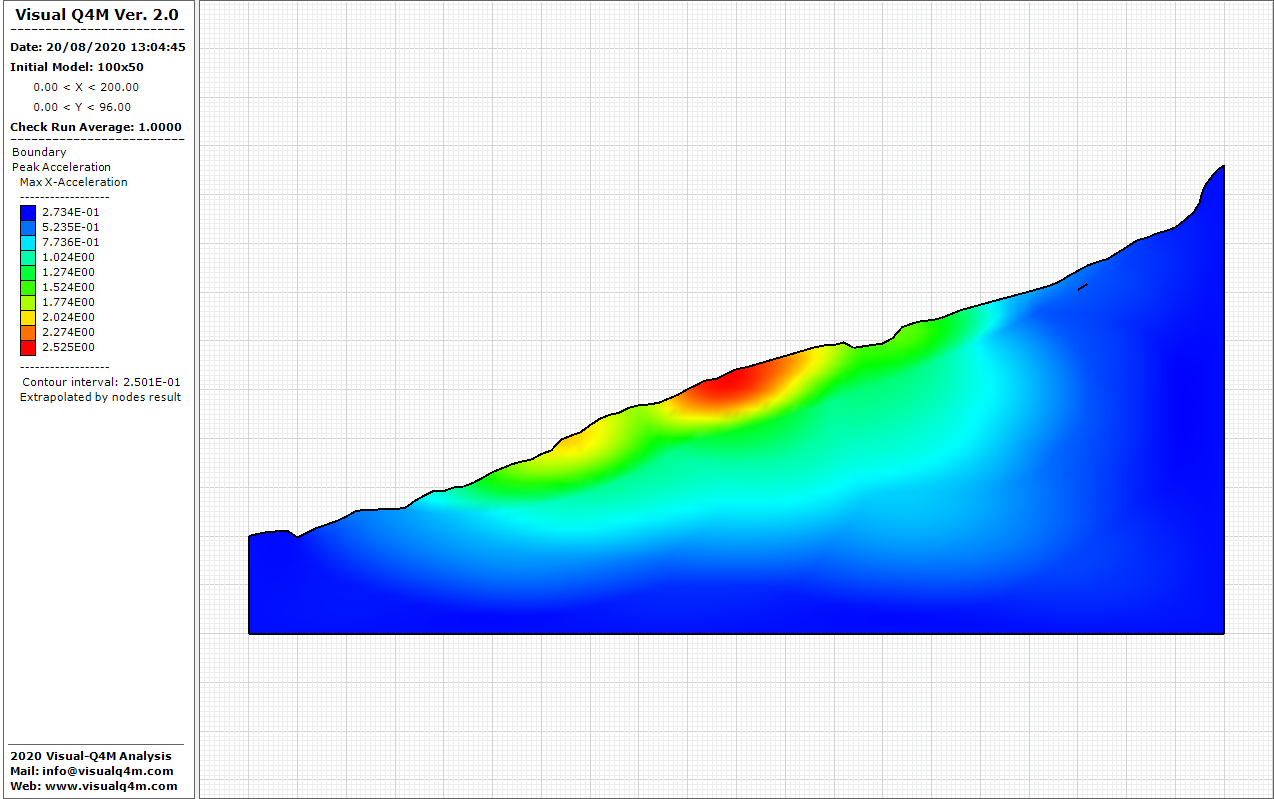
Seismic Local Amplification

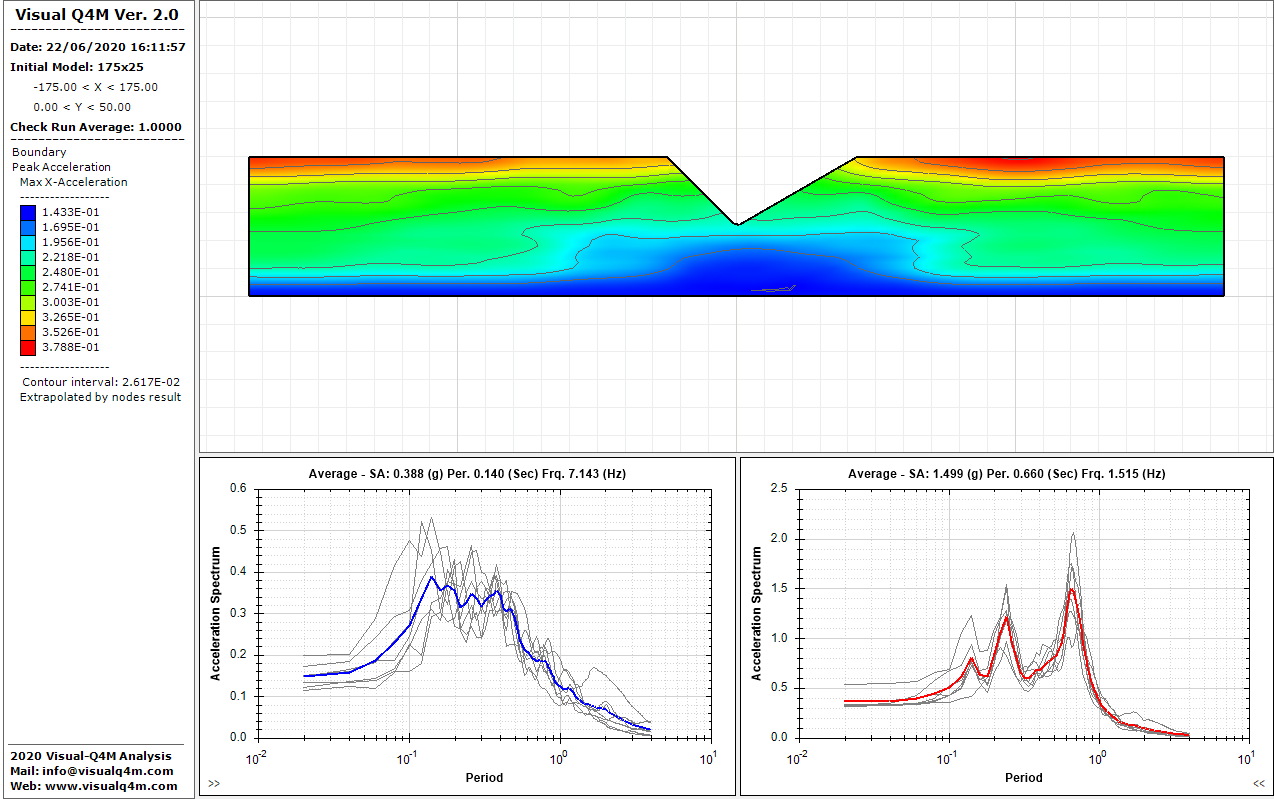
Focusing Effects
The main feature of Visual-Q4M is the introduction of simple graphic tools to speed up the management of numerical simulations for 2D seismic analysis with Quad4M code.

The grid is the work area of the numerical model and on it are inserted (by zone or groups of zones) the characteristics seismic-mechanical of the various soil types. Each grid is composed by a series of elements side by side matching in the nodes. A grid can be assembly also from a series of grid-blocks side by side to form a macro-grid deformable and moldable...

The VisualQ4M has a virtual grid editing environment where you can change the grid size and number of zones to fit the model to the section to be modeled. In this environment, for more precision, it's possible use also the vertices of the dxf file. The vertices of the grid-blocks (or of the single block) can be moved and hooked to the DXF vertices by modifying and deforming....

The changes on the grid come about within an environment characterized by a series of tools manual and automatic correction according to different criteria. The main conditions are defined in: GeoTable: is an open polyline. If it is generated changes the grid geometry; GeoRegion: is a closed polyline. If it is generated changes the grid geometry and identified...

The dynamic properties can be enter manually or calculated automatically: Density (N/m3): (Required for the dynamic analysis) Total unit weight. if not known can be derived from the value of the speed Vp; Vp (m/s): the speed of compression waves if not known can be derived from the value of the speed Vs and the Poisson coefficient...

The random distribution, for Density, Poisson, Shear Modulus and Damping, can be: Normal distribution: (or Gaussian), is a probability distribution that is symmetric about the mean, showing that data near the mean are more frequent in occurrence than data far from the mean. Uniform distribution: is a probability distribution where all outcomes are equally likely...

On the grid is possible to constrain the movement of each node along the axis "X", along the "Y" axis and simultaneously in the direction "XY". In this way to be block the motion of a single node with respect to a predetermined direction. Boundary conditions (x, y, xy or transmitting base) and Dynamic load (x, y or xy). All nodes of the grid are initially....

In the VisualQ4M it is possible to perform two types of dynamic analysis: Elastic linear analysis the properties Shear Modulus and Damping do not change during the calculation and you can make only a single run. For perform this type on analysis do not select none curve for the lithologies; Equivalent linear analysis: the properties of Shear Modulus and...
In Random option, the effects of nonlinear property parameters using the empirical model by Darendeli model are calculated. The variability of soil properties is modelled as a normal distribution, where the data near the mean are more frequent in occurrence than data far from the mean. G/G0 and D are generated from the initial curves (mean) and the values are computed as...
In the VisualQ4M it is possible to perform analysis with: Input Motion X - Component and Input Motion XY - Component. For to perform an analysis both in X and Y, the two components of the dynamic load must have the same number of records and the same time step. Is not possible perform an analysis only the Y-Component...
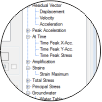
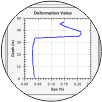
It is possible choose the items plot to view the results of the dynamic analysis. Model: Grid: grid of the current model. Lithology: lithologies of the current model. Deformation: deformed grid according to an amplification factor graph. You can change the color graphics using the menu Color Line and the exaggeration graphics using...

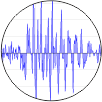
The Acceleration in output is recorded during the calculation cycle on the nodes selected. For Input and Output component it's possible view: Time Series (Accelerations, Velocity, Displacement): The graphics show time history and the max value (PGA, PGV, PGD) as a function of the dynamic time. Spectral Response (Accelerations, Velocity, Displacement)...
A grid assembly is composed of a series of grid blocks side by side to form a macro-grid deformable and moldable for simulate various geometries. The individual grid blocks are connected to each other and each one of them can be modified in size and in content of zones...
Check Natural Frequency
Resonance frequency
Concrete dam
Acceleration peak on the slope
Seismic Local Amplification
Focusing Effects
Copyright © 2025 - All Rights Reserved - visualq4m.com
Template by OS Templates